Oracle Database Blog: Experiments & Learnings

September 15, 2015

crsctl.bin: 0403-006 Execute permission denied

Filed under: Oracle RDBMS — Saurabh Manroy @ 9:10 am

Oracle Restart 11.2.0.3 with PSU14 and few one-offs, hosted on AIX 6.1 TL9

After a planned server reboot, HAS wasn’t able to start. Trying to start CRS gave the following error:

pic1

Permissions for the files looked like below:

pic2

which were similar to what was seen on other hosts where Oracle was healthy.

truss on the command yielded the following error:

pic3

From GNU, ENXIO means the following:

“Macro: int ENXIO

No such device or address. The system tried to use the device represented by a file you specified, and it couldn’t find the device. This can mean that the device file was installed incorrectly, or that the physical device is missing or not correctly attached to the computer.”

Because this was a test machine, I could afford to do a little more testing on this. Tried to move the file crsctl.bin and got the following:

pic4

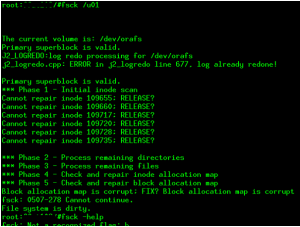
This was followed by running ‘fsck’ which confirmed that there was problem with the filesystem:

pic6

Another execution of fsck with Auto-fix option, helped. All problematic inodes reported above were auto-corrected. With same set of permissions (as reported earlier) for crsctl.bin and crsctl, Oracle HAS started without issues.

March 12, 2015

Slow SQL*Plus Login

Filed under: Oracle RDBMS — Saurabh Manroy @ 3:37 pm

Here is a bit of interesting investigation that I would like to share.

Application received timeouts while trying to connect to the database.

1

Connection via SQL*PLUS showed same results. Time taken to login was high for either bequeath or non-local connections.

SQL*PLUS connection was traced using strace. Relevant output is shown below.

Please note that elapsed time per call is reported on the far right of every system call.

open("/etc/hostid", O_RDONLY)           = -1 ENOENT (No such file or directory) <0.000020> 
open("/etc/hostid", O_RDONLY)           = -1 ENOENT (No such file or directory) <0.000018> 
uname({sys="Linux", node="xxxxx", ...}) = 0 <0.000017> 
stat("/etc/resolv.conf", {st_mode=S_IFREG|0644, st_size=0, ...}) = 0 <0.000018> 
open("/etc/resolv.conf", O_RDONLY)      = 9 <0.000019> 
fstat(9, {st_mode=S_IFREG|0644, st_size=0, ...}) = 0 <0.000016> 
mmap(NULL, 4096, PROT_READ|PROT_WRITE, MAP_PRIVATE|MAP_ANONYMOUS, -1, 0) = 0x2b880d500000 <0.000019> 
read(9, "", 4096)                       = 0 <0.000017> 
close(9)                                = 0 <0.000017> 
munmap(0x2b880d500000, 4096)            = 0 <0.000019> 
uname({sys="Linux", node="xxxxx", ...}) = 0 <0.000015> 
write(10, "\4N\0\0\6\0\0\0\0\0\3s\3\0\0\0\0\0\0\0\0\0\0\0\0!\0\0\0"..., 1102) = 1102 <0.000018> 
read(11, "\4j\0\0\6\0\0\0\0\0\10\30\0\23\0\0\0\23AUTH_VERSION_S"..., 8208) = 1130 <1.257143> 
open("/u01/app/oracle/product/11.2.0/dbhome_1/rdbms/mesg/oraus.msb", O_RDONLY) = 9 <0.000049> 

While it is evident that one of the read call took more time than expected (1.25 seconds), it was unclear as to what that read call was waiting on. Following the forked process using strace revealed the following:

[pid  5350] sendto(6, "\2\0\0\0\f\0\0\0\6\0\0\0group\0\0\0", 20, MSG_NOSIGNAL, NULL, 0) = 20
[pid  5350] poll([{fd=6, events=POLLIN|POLLERR|POLLHUP, revents=POLLIN|POLLERR|POLLHUP}], 1, 5000) = 1
[pid  5350] recvmsg(6, {msg_name(0)=NULL, msg_iov(1)=[{"group\0", 6}], msg_controllen=24, {cmsg_len=20, cmsg_level=SOL_SOCKET, cmsg_type=SCM_RIGHTS, {7}}, msg_flags=0}, 0) = 6
[pid  5350] fstat(7, {st_mode=S_IFREG|0600, st_size=217016, ...}) = 0
[pid  5350] pread(7, "\1\0\0\0h\0\0\0D\254\0\0\1\0\0\0\250\305XP\0\0\0\0\323"..., 104, 0) = 104
[pid  5350] mmap(NULL, 217016, PROT_READ, MAP_SHARED, 7, 0) = 0x2b646ca23000[pid  5350] close(7)                    = 0
[pid  5350] close(6)                    = 0
[pid  5350] getgid()                    = 501
[pid  5350] open("/u01/app/oracle/admin/bigb/adump/xxxxx_ora_5350_1.aud", O_RDWR|O_CREAT|O_EXCL, 0660) = -1 EEXIST (File exists) 
[pid  5350] open("/u01/app/oracle/admin/bigb/adump/xxxxx_ora_5350_2.aud", O_RDWR|O_CREAT|O_EXCL, 0660) = -1 EEXIST (File exists) 
[pid  5350] open("/u01/app/oracle/admin/bigb/adump/xxxxx_ora_5350_3.aud", O_RDWR|O_CREAT|O_EXCL, 0660) = -1 EEXIST (File exists) 
[pid  5350] open("/u01/app/oracle/admin/bigb/adump/xxxxx_ora_5350_4.aud", O_RDWR|O_CREAT|O_EXCL, 0660) = -1 EEXIST (File exists) 
[pid  5350] open("/u01/app/oracle/admin/bigb/adump/xxxxx_ora_5350_5.aud", O_RDWR|O_CREAT|O_EXCL, 0660) = -1 EEXIST (File exists) 
[pid  5350] open("/u01/app/oracle/admin/bigb/adump/xxxxx_ora_5350_6.aud", O_RDWR|O_CREAT|O_EXCL, 0660) = -1 EEXIST (File exists) 
[pid  5350] open("/u01/app/oracle/admin/bigb/adump/xxxxx_ora_5350_7.aud", O_RDWR|O_CREAT|O_EXCL, 0660) = -1 EEXIST (File exists)  
... 
...   
... and many more   
[pid  5350] open("/u01/app/oracle/admin/bigb/adump/xxxxx_ora_5350_186.aud", O_RDWR|O_CREAT|O_EXCL, 0660) = 6
[pid  5350] write(6, "Audit file ", 11) = 11
[pid  5350] write(6, "/u01/app/oracle/admin/bigb/adump"..., 55) = 55
[pid  5350] write(6, "\n", 1)           = 1  
... 
... 
... 
[pid  5350] write(6, "Thu Mar 12 11:37:08 2015 +01:00\n", 32) = 32
[pid  5350] write(6, "LENGTH : \'160\'", 14) = 14
[pid  5350] write(6, "\n", 1)           = 1
[pid  5350] write(6, "ACTION :[7] \'CONNECT\'\nDATABASE U"..., 159) = 159
[pid  5350] write(6, "\n", 1)           = 1
[pid  5350] write(12, "\0\225\0\0\6\0\0\0\0\0\10\0\0\4\1\0\0\0\0\0\1\0\0\0\0\0"..., 149 <unfinished ...> 
[pid  5344] <... read resumed> "\0\225\0\0\6\0\0\0\0\0\10\0\0\4\1\0\0\0\0\0\1\0\0\0\0\0"..., 8208) = 149 

As shown in above strace output, PID of sqlplus (user) process is 5344. It starts with read system call and calls forked (shadow) process (pid 5350) . The shadow process, before logging into the database has to make entry in the audit logs. For accomplishing this, it starts scanning the audit_trail directory to find the latest file (based on the acquired PID 5350) where the audit entry can be made. This scan is performed in sequential order. See the snippet below extracted from strace output.

xxxxx_ora_5350_1.aud',
xxxxx_ora_5350_2.aud',
xxxxx_ora_5350_3.aud',
xxxxx_ora_5350_4.aud',
xxxxx_ora_5350_5.aud',
xxxxx_ora_5350_6.aud',
xxxxx_ora_5350_7.aud',
xxxxx_ora_5350_8.aud',
xxxxx_ora_5350_9.aud',
xxxxx_ora_5350_a.aud',
xxxxx_ora_5350_b.aud',
xxxxx_ora_5350_c.aud',
xxxxx_ora_5350_d.aud',
xxxxx_ora_5350_e.aud',
xxxxx_ora_5350_f.aud',
xxxxx_ora_5350_10.aud',
xxxxx_ora_5350_11.aud',
xxxxx_ora_5350_12.aud',
xxxxx_ora_5350_13.aud',
xxxxx_ora_5350_14.aud',
xxxxx_ora_5350_15.aud',
xxxxx_ora_5350_16.aud',
xxxxx_ora_5350_17.aud',
xxxxx_ora_5350_18.aud',
xxxxx_ora_5350_19.aud',
xxxxx_ora_5350_1a.aud',
xxxxx_ora_5350_1b.aud',
xxxxx_ora_5350_1c.aud',
xxxxx_ora_5350_1d.aud',
xxxxx_ora_5350_1e.aud',
xxxxx_ora_5350_1f.aud',
...
...
xxxxx_ora_5350_182.aud';
xxxxx_ora_5350_183.aud';
xxxxx_ora_5350_184.aud';
xxxxx_ora_5350_185.aud';
xxxxx_ora_5350_186.aud';

So, the longer this list, more time will it take for session to login.

After sequential scanning of all the audit logs, the shadow process finally opens the latest file and writes an Audit Entry:

[pid  5350] open('/u01/app/oracle/admin/bigb/adump/xxxxx_ora_5350_186.aud', O_RDWR|O_CREAT|O_EXCL, 0660) = 6
[pid  5350] write(6, 'Audit file', 11) = 11

After a successful entry is made, control is given back to user process (pid 5344) which continues with the read operation.

[pid  5344] <... read resumed> "\0\225\0\0\6\0\0\0\0\0\10\0\0\4\1\0\0\0\0\0\1\0\0\0\0\0"..., 8208) = 149 

Finally, the control is given back to user console (note the file descripter below):

[pid  5344] read(0,  <unfinished ...> 
Process 5350 detached 

Solution

Audit trail directory reported around 1.2 million audit files.

oracle@xxxxx:/u01/app/oracle/admin/bigb/adump> ls -ltr | wc -l
 11840730

To fix this, recent audit logs were copied to another location and the curent location was cleaned up.

oracle@xxxxx:/u01/app/oracle/admin/bigb/adump> ls -ltr | awk '{print $NF}' | xargs rm
November 4, 2012

Grid Infrastructure 11.2.0.3 – Connections via listener show different Time-stamp ?

Last Sunday (28 October ’12), there was a time change in NL, from Daylight savings time to Winter time. For few of our 11.2.0.3 databases, connections via listener were showing DST time, while bequeath connections were showing correct time. At Unix level, the time shown was correct. Operating system : AIX 6.1 with TL7.

%echo $TZ
 EAT-1DST,M3.5.0/2:00,M10.5.0/3:00

%grep TZ /etc/environment
TZ=EAT-1DST,M3.5.0/2:00,M10.5.0/3:00
#TZ=MET-1METDST

%ls -ltr /etc/environment
-rw-rw-r-- 1 root system 2037 Jun 20 12:36 /etc/environment

The file /etc/environment was last modified on Jun 20th, lets check when was the listener started ?

%ps -ef |grep tns
 oracle 11010136 1 0 Jun 14 - 2:27 /u01/app/11.2.0/grid/bin/tnslsnr LISTENER -inherit
 oracle 24248480 18874570 0 21:01:04 pts/0 0:00 grep tns
%ps eww 11010136
 PID TTY STAT TIME COMMAND
 11010136 - A 2:27 /u01/app/11.2.0/grid/bin/tnslsnr LISTENER -inherit _=/u01/app/11.2.0/grid/bin/oraagent.bin LANG=C LOGIN=oracle __CLSAGENT_INCARNATION=1... __CLSAGENT_USER_NAME=oracle ... CRS_LIMIT_CORE=unlimited TZ=MET-1METDST CRF_HOME=/u01/app/11.2.0/grid AIXTHREAD_SCOPE=S RT_GRQ=TNS_ADMIN=/u01/app/11.2.0/grid/network/admin/

-- output of above command cut short for readability.

So, the listener was started on Jun 14 with a different TZ setting. This prompted us to perform a listener restart, which corrected the environmental settings of TZ variable for listener but connections via listener still showed DST time. A quick scan of alert log on both RDBMS and ASM revealed that time was still DST. Oracle support pointed us to note 1209444.1, which points out that starting 11.2.0.2, TZ settings for grid are stored in $GRID_HOME/crs/install/s_crs_config_<node_name>_env.txt . This text file gets populated as per environmental settings during the GRID install.

To fix the problem, we changed TZ variable in the file to exact value pointed to by the OS . This was followed by GI restart. Changed file looks like this:

%more s_crsconfig_<n1>_env.txt
### This file can be used to modify the NLS_LANG environment variable, which determines the charset to be used for messages.
### For example, a new charset can be configured by setting NLS_LANG=JAPANESE_JAPAN.UTF8
### Do not modify this file except to change NLS_LANG, or under the direction of Oracle Support Services
TZ=EAT-1DST,M3.5.0/2:00,M10.5.0/3:00
NLS_LANG=AMERICAN_AMERICA.WE8ISO8859P1
RT_GRQ=ON
EXTSHM=OFF
TNS_ADMIN=
ORACLE_BASE=

Note: root owns this file, so only root has privileges to edit it.

For Oracle Restart environment, this grid env. settings file is also present under $GRID_HOME/crs/install directory. Any changes to this file would entail a restart of High availability services daemon.

October 24, 2012

Tape Usage monitoring using Netbackup goodies and Oracle Tools

Filed under: Oracle RDBMS — Tags: , , — Saurabh Manroy @ 10:43 pm

Quite recently I got interested in one of the unattended (not so frequent) issue.  Every month, one or the other database backup reported problems because of tapes getting full in their respective tape pools. So, for me the task was to find out:

  1. All the  tape media in the Volume pools which had critically low free space.
  2. Then check if that tape gets full, how would it impact subsequent backup job.
  3. Based on the impact, if needed, raise an alarm.

Getting the Tape capacity

We are using Netbackup(tm) software to backup data to Virtual tape library. From Netbackup server console, you can see is how many KBs have been written to the tape but it doesn’t tell the total capacity of tape. As we are using LTO3 standard to format LUNs to be used as virtual tapes, the native (uncompressed) capacity of a tape drive is 400GB. I confirmed this figure by checking all tapes that had status FULL.

Impact and Alarms

For each allocated channel in the RMAN run block, MML tries to write to a different tape media in the volume pool.  So, for parallelism to be effective, # of tape drives available to be written to should be equal to the number of channels allocated for backup. If this is not the case, RMAN would allocate n channels but effectively less than n channels will be at work at any given time.

Based on this, Alarms should be raised:

Condition 1:

-> If the number of  (active + available) tapes are less than number of allocated RMAN channels for backup. For example: If 3 RMAN channels are allocated for backup, just 2 tapes are not sufficient for effective parallelism. In such case, an alarm email can be sent to the storage/DBA group with following content.

POOL_NAME   Active Tapes in Pool
----------- --------------------
 ora-pool            2

Condition 2:

->If a tape is currently 90% full, would filling this tape to 100% capacity lead to situation mentioned above. Example:

POOL_NAME    MEDIA_ID % Full   Active Tapes in Pool
----------- --------- -------  --------------------
ora-pool     090040     90.68       3

In the above output, if 0900400 tape media gets full, this volume pool will have only 2 tapes to write to. If RMAN is allocating 3 channels to backup, backups would get affected from channel queuing.

Solution

When you install Netbackup master server software,  a successful install would create  ‘goodies’  folder under ‘bin’ directory. This directory contains many useful scripts that can be used for monitoring media server. One script that  proved to be of use is : available_media.  For the script to work , it expects Netbackup Master server and media server software on same host. The script can be run only by root user. Sample output of this script is below:

# ./available_media | more
media   media   robot   robot   robot   side/   ret    size     status
ID     type    type      #     slot    face    level  KBytes
----------------------------------------------------------------------------
Backup pool1

07002G  HCART3   TLD      0       2      -       1     66099194 ACTIVE
07002H  HCART3   TLD      0       3      -       -     -        AVAILABLE

NetBackup pool

07002F  HCART3   TLD      0       1      -       -     -        DBBACKUP

Now, given the sample output above, you can either write a shell/perl program to manipulate and raise alarms (email saurabhmanroy(at)gmail.com for the shell program) or choose a complex method like below:

  • Modify Available_media script to provide input for SQL Loader
  • Pre-create table in the database.
  • Use SQL LOADER to load Tape data into a database table
  • Query relevant information from database and then truncate the table for future use.

Output of modified available_media_ora script looks like this:

ora-pool,11002O,419249568,FULL
ora-pool,11002N,95774112,ACTIVE
ora-pool,070033,Unknown,AVAILABLE

This can be loaded to a table in a database ( for example: RMAN catalog db or Grid/cloud control repository db). A sample controlfile for sql loader will be:

LOAD DATA
INFILE '/u01/oracle/tape_check/load.txt'
INTO TABLE Tape_repository
FIELDS TERMINATED BY ','
(POOL_NAME,
Media_id,
Size_KBytes,
status)

Finally, queries to get the data of interest:

-- 1st Query
select pool_name,count(*) "Total Active Tapes"
 from tape_repository
 where Status <> 'FULL'
 and pool_name like '%ora'
 group by pool_name having count(*) < #rman_channels - 1;

-- 2nd Query

with tab as
(select *
 from tape_repository
 where POOL_NAME like '%ora%'
 and status <> 'FULL'
 and SIZE_KBYTES/1024/1024 > (400*0.9))
select a.pool_name,a.media_id,round((a.size_kbytes/1024/1024)/400*100,2) "% Full",count(b.media_id) "Active Tapes in Pool"
 from tab a , tape_repository b
 where a.pool_name=b.pool_name
 and b.status <> 'FULL'
 group by a.pool_name,a.media_id,a.size_kbytes,a.status
 having count(b.media_id) < #rman_channels;

-- replace #rman_channels by appropriate number

June 4, 2012

WARNING: failed to write mirror side 1 of virtual extent xx logical extent – Whats wrong with my hardware ?

Filed under: Oracle RDBMS — Tags: , , , , — Saurabh Manroy @ 9:45 am

How would you start the diagnostics if you see the following error:

RDBMS Alert log

ORA-27063: number of bytes read/written is incorrect
WARNING: IO Failed. subsys:System dg:1, diskname:/dev/roralv disk:0x0.0xdb804e82 au:408959
 iop:0x1106e4b50 bufp:0x116844000 offset(bytes):428825575424 iosz:65536 operation:2(Write) synchronous:0
 result: 4 osderr:0x0 osderr1:0x0 pid:1421568
Errors in file /oracle/diag/rdbms/bi1/bi1/trace/bi1_ora_1421568.trc:
ORA-15080: synchronous I/O operation to a disk failed
WARNING: failed to write mirror side 1 of virtual extent 48509 logical extent 0 of file 287 in group 1 on disk 0 allocation unit 408959
ORA-1114 : opiodr aborting process unknown ospid (1421568_1)
Errors in file /oracle/diag/rdbms/bi1/bi1/trace/bi1_ora_1421568.trc (incident=46471):
ORA-00600: internal error code, arguments: [kfmdSlvLeaveWrt1], [3], [], [], [], [], [], [], [], [], [], []
ORA-01114: IO error writing block to file 207 (block # 3104636)
ORA-15081: failed to submit an I/O operation to a disk

ASM Alert log

ORA-27072: File I/O error
Additional information: 7
Additional information: 837548032
Additional information: 1044480
WARNING: IO Failed. subsys:System dg:1, diskname:/dev/roralv disk:0x0.0xdb804e82 au:408959
 iop:0x110a51dd0 bufp:0x110615c00 offset(bytes):428824592384 iosz:1048576 operation:1(Read) synchronous:1
 result: 4 osderr:0x0 osderr1:0x0 pid:2580822

You might look at :

a.) Tracefiles accompanying the error. It would provide you the Session information, the Failing SQL, Call Stack and loads of other information.  Initial attempt might be to Re-run the failing sql to see if the error persists. If yes, followed by ‘analyze table’ on the underlying tables used in the query.

b.) Another option is to find out what is file# 207, a datafile or a tempfile ? Based on the db_files parameter you can get that information. Would running dbv prove beneficial ? If it is a tempfile, is it corrupted ? Would dropping the tempfile help ?

c.) Looking at the warning messages in the alert log, you might be tempted to think that its a hardware problem. Because it is a write error, has someone changed the permissions of the disk (/dev/roralv) ?

While all of the above information is helpful to check the sanity of system, but it is not real cause of problem.

Issue was due to insufficient free diskspace on the diskgroup (using external redundancy) where tempfile ( file# 200 + 7) was present. Tempfile was autoextensible with maxsize set to unlimited. Because the error was reported on a test system which is not monitored by the monitoring server, warning alarms for diskgroup usage were not created.

Point here is:  why not report a simple ORA-01652 in the alert log of RDBMS or an ORA-15041 in ASM alert log  rather than a bunch of scary misleading messages ?

May 13, 2012

SPM and SQL Profiles

Filed under: Oracle RDBMS — Saurabh Manroy @ 9:40 am

What happens if  a sql statement has both a SQL profile and a SQL plan baseline ? Blog post by Maria Colgan from Oracle Query Optimizer Development team explains how three steps of Sql plan management i.e. Plan Capture, Selection and Evolution get influenced when a SQL profile is present.

April 27, 2012

Oracle Trace Data Session in Utrecht – Cary Millsap

Filed under: Oracle RDBMS — Saurabh Manroy @ 12:28 pm

I’ll be attending my first ever Oracle Seminar/event next month. The session will be delivered by none other than Cary Millsap and has been organized by Ciber. Really looking forward to hear from the founder of  Method-R corporation. Here is the link for the details and registration for event in case you want to register.

February 29, 2012

Log file Sync waits in RAC

Problem

Huge Log file sync waits during 3 hour run of ETL job (Extract, transform, Load) on one of the nodes of  2 Node RAC cluster.

Environment

2 Node RAC

Block Size: 16K

ClusterWare Version: 11.1.0.7

RDBMS and ASM Version: 11.1.0.7.9

OS : AIX 6.1

Storage Vendor : Oceanstor s2900

Number of LMS processes: 2 per node, running in Real Time priority as expected.

Background

Log file sync wait for Single Instance DB has been explained in depth in many blogs. I will take a moment to extend its definition for RAC and summarize the sequence of events involved in log file sync wait:

1.) User issues commit/rollback(ends with a commit) and wakes up log writer (LGWR). The wait time for log file sync starts here.

2.) LGWR issues/queues write call to OS to write to disk, refreshes the logical scn and asynchronously posts LMS to broadcast this SCN (BOC) from the local instance to other instances in cluster.

While I/O subsystem completes the write to disk, LGWR itself starts waiting on ‘Log File Parallel Write‘.

Wait counter for ‘wait for scn ack‘ also starts ticking now.

3.a) Once write is complete, OS posts back to LGWR. This is where wait counter for log file parallel write stops. For every slow write to disk (log write taking more than 500ms), a warning is written to LGWR tracefile “Warning: log write time 550ms, size 17KB 

3.b) By this time,  if local node has not received the SCN acknowledgement for the BOC post sent to remote nodes in step 2, LGWR continues to wait on “wait for scn ack” event. If this wait for scn acknowledgement is more than 500ms, another warning get logged to the lgwr tracefile “Warning: log write broadcast wait time 670ms”

Note: In 11.1 RAC, For a simple commit statement, it is easy to see this otherwise invisible wait event by setting “_lgwr_async_broadcasts”=false and by enabling 10046 trace on LGWR.

11.2 has another interesting parameter “_lgwr_posts_for_pending_bcasts”  which is set to False by default. I am yet to test its impact on log file sync waits.

4.) Once acknowledgement is received by LGWR from other instances , LGWR posts back to user that write is complete (commit is durable).

5.) Right after posting back to user session, log file sync wait counter stops.

Its worth noting that with all these steps involved in log file sync waits, CPU scheduling plays a crucial role in almost every step.  It is possible that LGWR doesn’t get CPU cycle immediately and has to wait in run-queue.  All this wait time would add to the user ‘log file sync’ wait time.

Analysis

Areas to analyze:

a.) Commit Frequency

b.) I/O response time

c.) CPU starvation

d.) Bugs relevant to BOC scheme.

Commit Frequency

Number of commits were high. Sections from AWR:


             Snap Id           Snap Time       Sessions Curs/Sess
             ---------     ------------------- -------- ---------
 Begin Snap: 10525         17-Feb-12 02:00:53     118    2.1
 End Snap:   10526         17-Feb-12 03:00:04     158    2.7
 Elapsed:       59.17 (mins)
 DB Time:    1,020.28 (mins)

Top <del>5</del> 2 Timed Foreground Events
~~~~~~~~~~~~~~~~~~~~~~~~~~~~~
                                                        Avg
                                                        wait   % DB
Event                            Waits         Time(s)  (ms)   time   Wait Class
------------------------------ ------------ ----------- ------ ------ ----------
log file sync                    12,689,306     36,776    3     60.1     Commit
DB CPU                                           5,164           8.4

Statistic                            Total            per Second     per Trans
-------------------------------- ------------------ -------------- -------------
redo size                            10,635,966,936    2,995,679.1         799.5
user I/O wait time                          608,253          171.3           0.1
user calls                               17,928,502        5,049.7           1.4
user commits                             12,801,929        3,605.7           1.0
user rollbacks                              501,433          141.2           0.0

I/O Response Time

LGWR tracefile showed some latency in write time:

*** 2012-02-16 02:53:21.691
Warning: log write time 550ms, size 17KB
Here is output from v$event_histogram for log file parallel write wait, for this db instance (started 3 days before the analysis):
 EVENT#             EVENT           WAIT_TIME_MILLI WAIT_COUNT
---------- ------------------------ --------------- ----------
 126       log file parallel write      1            59580471
 126       log file parallel write      2             3022225
 126       log file parallel write      4             1797856
 126       log file parallel write      8              624168
 126       log file parallel write     16              169960
 126       log file parallel write     32               46138
 126       log file parallel write     64               18218
 126       log file parallel write    128                4825
 126       log file parallel write    256                1188
 126       log file parallel write    512                 353
 126       log file parallel write   1024                  39
 126       log file parallel write   2048                   2

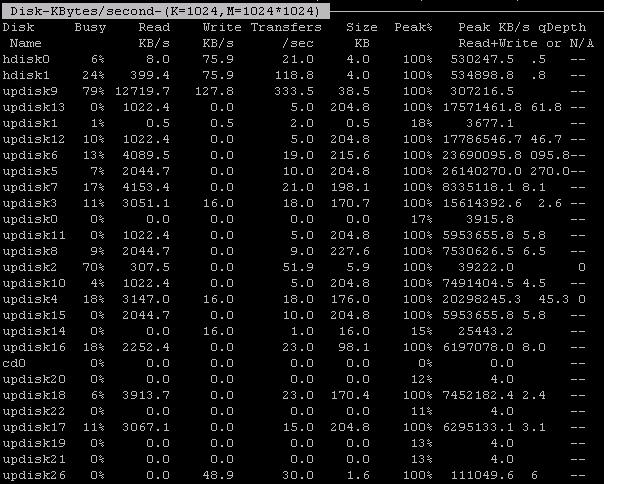
Redo Logfiles were/are not multiplexed. However, stored on same RAID 5 disk array as Datafiles. A new REDO_DG was created using disks from a different disk array than datafiles (though this one was also RAID 5) and redo logfiles from both instances were moved to a new disk array. Result: Little improvement.

*** 2012-02-18 03:26:35.293
Warning: log write time 500ms, size 9KB

In the snapshot above, updisk26 represents the disk holding the redo logfiles. In this snapshot, Busy% is Zero. However, there were some snapshots taken with busy% around 40 and an occasional 90.

As disk is part of RAID5 array, Parity calculation(even though it happens in background for newer SAN controllers) for every small write to disk might be adding to problems.

CPU Usage

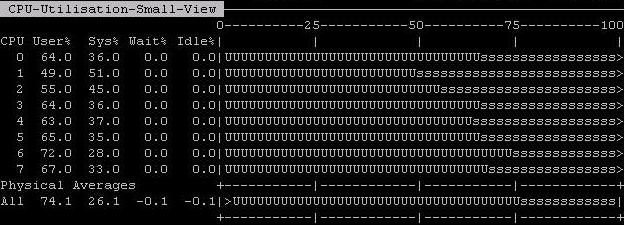
Below is one of the many snapshots taken during the ETL run.  Tool used : NMON (AIX)

CPU usage peeked 100%. Reason:  An application Module is also running on the DB Host, which is hogging CPU time.

LGWR is not getting enough CPU cycles ?

Bugs relevant to BOC scheme

MOS has a really educative note (ID: 259454.1) explaining different SCN generation Schemes i.e. Lamport SCN Generation and Broadcast on Commit SCN generation Scheme. It also discusses the reason to switch to BOC scheme as default SCN generating Scheme starting 10gR2.

During the ETL job, following messages appeared in lgwr trace, which to me needed more research as to why and how this can impact log file sync waits.  Thats how I came up with the fresh write-up for the log file sync wait event for RAC.

*** 2012-02-17 02:17:33.868
Warning: log write broadcast wait time 670ms
*** 2012-02-17 22:30:54.316
Warning: log write broadcast wait time 3000ms
-- RAC Specific waits from AWR Report
Statistic                            Total            per Second     per Trans
-------------------------------- ------------------ -------------- -------------
broadcast on commit wait time(ms)      937,303         264.0          0.1
broadcast on commit waits            1,669,140         470.1          0.1

Reasons for these waits mostly point to a bug with symptoms of : huge wait time for ‘wait for scn ack’   or lgwr unable to handle multiple posts at the same time.

There are three bugs reported on top of 11.1.0.7 related to log file sync waits & BOC and all of them are worth looking at.

Bug 8490879 – Long “log file sync” latencies due to broadcast on commit scheme
Bug 7716356 – Long “log file sync” latencies with broadcast on commit scheme in RAC
Bug 7610362 – Long “log file sync” waits in RAC with broadcast on commit in RAC

Finally, Options to Consider

a.) Increase number of CPUs on the system.  Then, if needed, bump up the priority of LGWR (renice) at OS level.  If  needed put LGWR in the list of “_high_priority_processes”. LNS and VKTM are already in the list on 11.1

b.) RAID5 is said to provide reasonable sequential write performance, but I am yet to test it. RAID 0 (Striping only) might prove to be a better bet for log files. It is also possible that this I/O subsystem is unable to perform as expected with writes which are smaller than the Stripe size defined for RAID.

c.) Move ETL module of application hosted on the DB Server to a different host.

d.) Reduce the number of commits.

e.) Raise an SR to get a confirmation if problem is due to any known bugs with 11.1.0.7 version.

— Comments and feedback are welcome

January 25, 2012

Oracle Database and IPV6

Target Audience: Oracle Database Professionals.

Information about IPV6 is all over the internet. There is wealth of articles published by different Network infrastructure companies and Linux/unix forums discussing and explaining IPV6 in depth.

It is not long ago when Oracle announced IPV6 support for its software for Database Technology(Starting version 11.2).  This post covers basic introduction to IPV6 along with its impact on Oracle Database Technology.

Why IPV6 ?

Major contributing factor for evolution of IPV6 is: Address space Exhaustion in IPV4.  Less address space in IPV4 forced users to use Network Address Translation (NAT).

What does an IPV6 Address look like ?

  • Is 128 bit. IPV4 address is 32bit.
  • Uses Hexadecimal Notation.
  • Separated by colons (:) rather than dots (.)
  • 128 bit address has two parts : Network prefix (64-bit) and Host part (64-bit).

Example of a IPV6 address is :  2001:db8::1234:1235:abcd:abef

IPV6 addresses can be shrunk by removing any consecutive occurrence of zeroes in the Address.  For example: In IPV4, loopback address looks like 127.0.0.1, an IPV6 equivalent is 0000:0000:0000:0000:0000:0000:0000:0001 , which can be re-written as ::1.  On same lines, a non-specified address in IPV4 is 0.0.0.0, its equivalent in IPV6 is ::

IPV6 Configuration

A quick method for checking and configuring your kernel for IPV6 readiness is:

a.) Check if your kernel IPV6 module is loaded for use:

cat /proc/net/if_net6

b.) If  above statement doesn’t give any output or errors out, load the IPV6 module as root user:

[root@ora-smanroy~]# modprobe ipv6

If this also errors out, modify /etc/modprobe.conf and hash-out the following entries:

#alias net-pf-10 off
#alias ipv6 off
#options ipv6 disable=1

After this, retry the modprobe command and it should execute succesfully.

c.) Take a server host restart. Just restarting Network services didn’t prove useful in my case (OEL 5.6).

After this, adding IPV6 interface is easy and can be done by following command:

/sbin/ifconfig <interface> inet6 add <ipv6address>/<prefixlength>

….Can I use ping ?

Some network (IP Address related) utilities that were available in IPV4 were rewritten for IPV6. For example, PING can’t be used to ping an IPV6 address. Rather we need to use PING6 utility. This is available on all platforms starting from linux kernel 2.4.X , though recommended linux kernel for IPV6 use is 2.6.x.  PING6 is also available on Windows starting windows XP SP1. An example from OEL 5.6 (2.6.x kernel)  is posted here:

[oracle@ora-smanroy admin]$ ping6 2001:db8::1234:1235:abcd:abef
PING 2001:db8::1234:1235:abcd:abef(2001:db8::1234:1235:abcd:abef) 56 data bytes
64 bytes from 2001:db8::1234:1235:abcd:abef: icmp_seq=0 ttl=64 time=0.030 ms
64 bytes from 2001:db8::1234:1235:abcd:abef: icmp_seq=1 ttl=64 time=0.042 ms
64 bytes from 2001:db8::1234:1235:abcd:abef: icmp_seq=2 ttl=64 time=0.036 ms

--- 2001:db8::1234:1235:abcd:abef ping statistics ---
3 packets transmitted, 3 received, 0% packet loss, time 1999ms
rtt min/avg/max/mdev = 0.030/0.036/0.042/0.005 ms, pipe 2

Here is output of ‘ifconfig’ command on a machine configured with IPV4 and IPV6 interface:

[root@ora-smanroy ~]# ifconfig
eth0 Link encap:Ethernet HWaddr 10:78:D2:CA:7D:EC
inet addr:192.168.66.160 Bcast:192.168.66.255 Mask:255.255.255.0
inet6 addr: 2001:db8::1234:1235:abcd:abef/64 Scope:Global
inet6 addr: fe80::1278:d2ff:feca:7dec/64 Scope:Link

From the output, IPV6 address is represented by a colon separated hexadecimal number. “/64” which is appended after the IPV6 address is similar to IPV4 netmask notation, specifying how many bits are used for network prefix.  “Scope: Global” specifies that it doesn’t belong to any other ‘reserved’ category like (loopback, link, multicast) and it should be ping-able if interface is up. Next line specifies the ‘Link’ address (Scope: Link) which specifies that it is a special address which is valid only on this interface. Using this address as destination, packet would never pass through the router. IPV6 requires the link-local address to be assigned to each interface on IPV6. Due to this, IPv6 hosts usually have more than one IPV6 address assigned to each of their IPv6-enabled network interfaces. Table below specifies the network prefix for IPV6 that helps us quickly identify if the interface is link-local or site-local or Global.

Address type IPv6 notation
Link-local unicast FE80::/10
Site-local unicast FEC0::/10
Global unicast

More details on Address Types and  IPV6 packet Header can be found by a quick google search.

Two IPV6 addresses in same subnet ?

As  mentioned earlier, IPV6 address has a network prefix (64 MSB) that helps in identification of hosts in a subnet.  Consider following IPs:

2001:db8::1234:1235:abcd:abef/64
2001:db8::1234:1235:abcd:abe1/64
2001:db8::1234:1235:abcd:abe2/64

These IPs are in same subnet, because the network prefix (2001:db8::) is same for all hosts and number of bits allotted for network prefix is also the same (64). Note that /48 and /32 are also some of the possible and valid notations for network prefix.

Oracle Listener and IPV6

As we know, if we configure hostname in listener.ora, it listens on all interfaces. So, no change would be needed for listener.ora if hostname is used and IPV6 is configured. However, if you only want IPv6 clients to connect to database server, you can specify IP=V6_ONLY in the listener.ora file. Other valid value for IP parameter is V4_ONLY. Support for IP=FIRST still exists. Consider that underlying OS kernel supports IPV6 and it is installed on the DB server.  To listen to requests from a mixture of IPv4 and IPv6 clients, Listener.ora can have following entries (if not using hostname) and would be good to listen to connections from either IPV4 or IPV6 clients.

PROD =
 (DESCRIPTION_LIST =
 (DESCRIPTION =
 (ADDRESS_LIST =
 (ADDRESS = (PROTOCOL = TCP)(HOST = 192.168.66.160)(PORT = 1535))
 (ADDRESS = (PROTOCOL = TCP)(HOST = 2001:db8::1234:1235:abcd:abef)(PORT = 1535))
 )
 )
 )

Let’s start services and then check at OS level:

[oracle@ora-smanroy admin]$ netstat -an | grep 1535 | grep LISTEN
tcp 0 0 192.168.66.160:1535 0.0.0.0:* LISTEN
tcp 0 0 2001:db8::1234:1235:ab:1535 :::* LISTEN

There is no change in the way /etc/hosts files hold IP addresses  :

-- /etc/hosts
# IPV6 Entries
::1 localhost
2001:db8::1234:1235:abcd:abef ora-smanroy

Oracle Client

There is no change as such in the way clients connect to database.  I have covered a simple example anyways:  Consider Oracle Database server host which is listening for requests from both IPV4 and IPV6 clients. Such a host is referred to as a Dual Stack host (supporting both IPV4 and v6). Suppose, an IPV4 Oracle client software tries to connect to the server. Client would try to connect to every IP returned by DNS/DB server until connection is successful or all addresses have been tried. This can be seen by setting TNSPING trace. Following is the trace from an IPV4 host trying to connect directly (without DNS) to DB server listening on both IPV4 and IPV6 interfaces

-- only relevant section shown
nsc2addr: (DESCRIPTION=(ADDRESS=(PROTOCOL=TCP)(HOST=ora-smanroy)(PORT=1535))(CONNECT_DATA=(SERVER=DEDICATED)(SERVICE_NAME=PROD)))
nttbnd2addr: entry
snlinGetAddrInfo: entry
snlinGetAddrInfo: getaddrinfo() failed with error 11001      --- fails to connect to IPV6
snlinGetAddrInfo: exit
nttbnd2addr: looking up IP addr for host: ora-smanroy        --- Performs further lookup
snlinGetAddrInfo: entry
snlinGetAddrInfo: exit
snlinFreeAddrInfo: entry
snlinFreeAddrInfo: exit
nttbnd2addr: exit
nsmal: 996 bytes at 0x1e9a268
nsmal: 2096 bytes at 0x1e9a658
nsmal: 84 bytes at 0x1e9a078
nsopen: opening transport...
nttcon: entry
nttcon: toc = 1
nttcnp: entry
nttcnp: exit
nttcni: entry
nttcni: Tcp conn timeout = 0 (ms)
nttcni: trying to connect to socket 1760.
snlinGetNameInfo: entry
snlinGetNameInfo: exit
nttcni: connected on ipaddr 192.168.66.121      --- Resolves to IPV4

If client is dual stack and IPV6 enabled,  it prefers IPV6 address for connection as per RFC 3484. Also, EasyConnect method is still supported to connect to IPV6 hosts. However, we need to use square brackets “[]” around the IPV6 address in the connection string. There is no ‘tnsping6’, ‘tnsping’ still works happily for IPV6 😉

IPV6, Oracle and Future

  • Grid Infrastructure Support

Oracle is yet to announce IPV6 support for Grid Infrastructure / RAC stack.  I believe among other things, underlying code for the Grid Naming Service would undergo some change.

  • Support for IPV6 JumboGrams

Like support for Jumbo Frames in IPV4, it would be interesting to see if Oracle would support JUMBOGRAMS in IPV6 for interconnect traffic, which can theoretically have a payload size of 4GB -1 (2^32 -1).  This is because, IPV6 uses separate extension header for jumbogram, making full use of 32 bit available for payload. IPV4 has theoretical payload size limit of (2^16 – 1).

January 18, 2012

Unrecoverable SCN

Filed under: Oracle RDBMS — Tags: , , — Saurabh Manroy @ 6:11 pm

No-logging operations leave their trail in Redologs and Controlfile. In redologs, the change record is marked with special OPCODE (19.2), with a line following the OPCODE suggesting that change record is due to Direct Path Load. This can be seen by dumping the redolog file. This information in redologs is used by Oracle during media recovery to check for objects impacted by nologging operations. This is covered in depth here by Oracle Expert Riyaj.

In controlfile, information about nologging operation is updated using a field called Unrecoverable SCN. This can be easily seen from UNRECOVERABLE_CHANGE# column in v$DATAFILE which records the highest SCN from last nologging operation performed. Another option is to dump controlfile at level 3 and search tracefile for word ‘unrecoverable’.

This unrecoverable SCN field in controlfile is used by RMAN to provide output for ‘REPORT UNRECOVERABLE’ command. While this is handy,but updating small piece of information in Controlfile requires the session to take CF Enqueue and if multiple Controlfiles are configured, wait events for CF parallel write can be easily seen. Such controlfile enqueue situation gets amplified and can become cause of slowdown in a large Direct Path Load operation.

Prior to 11.2, Event 10359 is available to disable such updates to Controlfile. 11.2.0.2 formally introduced a parameter DB_UNRECOVERABLE_SCN_TRACKING to disable updating the controlfile with unrecoverable SCN from nologging operations. However 11.2.0.2 patchset suffers from bug 12360160 which makes the parameter change ineffective untill next database restart. This bug has been fixed in 11.2.0.3.

Here is a bit of proof to the theory above from 11.2.0.3:

db_unrecoverable_scn_tracking = TRUE

PROD> show parameter scn
NAME                                     TYPE        VALUE
------------------------------------ ----------- ------------------------------
db_unrecoverable_scn_tracking          boolean        TRUE

SQL> create table test_nolog tablespace test_uscn NOLOGGING as select * from DBA_SOURCE;
Table created.
-- From 10046 Trace

Event waited on                          Times   Max. Wait Total Waited
---------------------------------------- Waited ---------- ------------
Disk file operations I/O                     7     0.00       0.00
direct path write                          208     0.00       0.03
direct path read                            11     0.00       0.00
direct path sync                             1    13.96      13.96
control file sequential read                 9     0.00       0.00
control file parallel write                  4     0.00       0.00

SQL> select name,file#,unrecoverable_change# from v$datafile where file#=6;
NAME                                       FILE#    UNRECOVERABLE_CHANGE#
---------------------------------------- ---------- ---------------------
/u01/app/oracle/oradata/test_uscn.dbf        6         4045395

-- Controlfile Dump

SQL> oradebug setmypid
Statement processed.
SQL> oradebug dump controlf 3;
Statement processed.
SQL> oradebug tracefile_name
/u01/app/oracle/diag/rdbms/prod/PROD/trace/PROD_ora_30579.trc

-- From Tracefile:

DATA FILE #6:
 name #1: /u01/app/oracle/oradata/test_uscn.dbf
creation size=25600 block size=8192 status=0xe head=1 tail=1 dup=1
 tablespace 11, index=7 krfil=6 prev_file=0
 unrecoverable scn: 0x0000.003dba53 01/18/2012 16:54:31
 Checkpoint cnt:2 scn: 0x0000.003db52c 01/18/2012 16:44:03

-- Connect to RMAN

RMAN> report unrecoverable;
using target database control file instead of recovery catalog
Report of files that need backup due to unrecoverable operations
File  Type of Backup Required       Name
----  -----------------------     -----------------------------------
6           full or incremental    /u01/app/oracle/oradata/test_uscn.dbf

-- Now backup datafile.

RMAN> backup datafile 6;
Starting backup at 18-JAN-12
allocated channel: ORA_DISK_1
channel ORA_DISK_1: SID=24 device type=DISK
channel ORA_DISK_1: starting full datafile backup set
channel ORA_DISK_1: specifying datafile(s) in backup set
input datafile file number=00006 name=/u01/app/oracle/oradata/test_uscn.dbf
channel ORA_DISK_1: starting piece 1 at 18-JAN-12
channel ORA_DISK_1: finished piece 1 at 18-JAN-12
piece handle=/u01/app/oracle/oradata/backup/1kn13a8t_1_1 tag=TAG20120118T170221 comment=NONE
channel ORA_DISK_1: backup set complete, elapsed time: 00:00:16
Finished backup at 18-JAN-12
RMAN> report unrecoverable;
using target database control file instead of recovery catalog
Report of files that need backup due to unrecoverable operations
File Type of Backup Required Name
---- ----------------------- -----------------------------------
RMAN>

db_unrecoverable_scn_tracking = FALSE

SQL> alter system set db_unrecoverable_scn_tracking=false;
System altered.

-- switch on 10046 trace

SQL> create table test_noscn tablespace test_uscn NOLOGGING as select * from DBA_SOURCE;
Table created.

From 10046 trace (only relevant events shown):

Event waited on                           Times Max. Wait Total Waited
 ---------------------------------------- Waited ---------- ------------
 direct path write                         208     0.00        0.03
 direct path read                           15     0.00        0.00
 direct path sync                            1    13.70       13.70
-- No Controlfile updates/Waits

SQL> select name,file#,unrecoverable_change# from v$datafile where file#=6;
NAME                                        FILE#     UNRECOVERABLE_CHANGE#
---------------------------------------- ---------- ---------------------
/u01/app/oracle/oradata/test_uscn.dbf        6            4045395 <<<-- Keeeps the old SCN

-- Lets check from RMAN:

RMAN> report unrecoverable;
using target database control file instead of recovery catalog
Report of files that need backup due to unrecoverable operations
File Type of Backup Required Name
---- ----------------------- -----------------------------------
RMAN>

Older Posts »

Blog at WordPress.com.